Disclaimer

Disclaimer: The information found on this site is meant for educational and informational purposes only. Nothing on this site should be construed as a recommendation or solicitation to buy or sell derivatives or securities or to trade any particular strategy. Trading of derivatives or securities has large potential risk and you must be aware of and accept all the risks. Past performance of any trading system or methodology is not necessarily indicative of future results. No representation is being made that any account will or is likely to achieve performance results similar to those discussed on this website. Hypothetical or simulated performance results have certain limitations and do not represent actual trading.

Sunday, October 21, 2012

VIX Rising to 20.83 in the Next 2 Weeks?


As you can see in the chart of VIX above, the P&F Trend Indicator (from MetaStock) that I use for VIX turned positive once again as of VIX closing price of October 19, 2012.  I look at this indicator because it turns positive so infrequently when it comes to VIX.  Last time P&F Trend Indicator turned positive was on May 4, 2012.  At that time, I wrote a research piece titled "VIX Rising to 24.6 Before May VIX Settlement?" in my blog.  In fact, VIX rose from 19.16 on May 4th to 21.97 the last trading day of VIX May expiration.  VIX continued to rise as high as 25.1 over the subsequent few trading days.

The table below shows the instances when VIX was under 25 and P&F Trend Indicator turned positive over the past 12 years.


Unlike in my May 4th post, I added a calculation of averages excluding what I considered outliers (highlighted in green & yellow) to come up with average or expected Max % Gain & Max % Loss of VIX looking 10 trading days forward.  Based on the average numbers, VIX could be expected to rise as high as 20.83 or fall to as low as 16.04 over the next two weeks.  Furthermore, using these VIX ranges, VXX then could be expected to trade within 40.6 to the upside or 33.4 over the next two weeks.  VXX ranges are calculated (roughly) with assumptions about how it has moved in the past relative to VIX movements.

I understand that trying to calculate "Expected" or "Average" numbers with such few data samples is not quantitatively reliable.  Nevertheless, it is a worthwhile exercise to carry out when formulating a trading strategy based on scenarios of how VIX may be expected to move.  Perhaps, buying the VXX November 35/38 call spread could be a good trade.

Sunday, September 30, 2012

Differences in Perception & Reality: Time to Go Long Volatility


Back in late August and early September, and ahead of ECB announcement, S&P500 Index experienced a period consolidation.  As you can see in the first blue oval, the market went sideways, then took off after  Draghi's announcement of Outright Monetary Transactions (OTM) policy.  Over the past two weeks, the market has also undergone a consolidation of sort.

The interesting difference between these two periods of consolidation is VIX (shown in plum) movements and my Fair Volatility Estimate or FVE Indicator (shown in blue).  As you can see indicated by the red arrow, VIX steadily rose ahead of the ECB announcement to 18 level, while FVE remained low and in a declining trend.  After the ECB announcement, VIX plunged.

Recently, however, FVE has been steadily rising, yet VIX has remained mostly below FVE Indicator's values during this consolidation and also below its values during the previous consolidation.

The reality is that the current ongoing consolidation of the S&P500 Index is showing greater volatility, yet market volatility perception as measured by VIX is not quite reflecting this.  I believe presents a good expected payoff scenario in favor of going long volatility.

Thursday, September 6, 2012

VIX Back Month Futures At Record Premiums!

VIX back month future prices seem really high to me.  March 2013 VIX futures are trading at 27.30, April 2013 VIX futures are 27.85, and May 2013 VIX futures are 28.20!  Historically, the median VIX level has been 19.8.  Furthermore, I calculated that VIX has been above 40 just 3.6% of the times since 1994, but 29% of the times it has been below 16.  With these probabilities, I get 8 to 1 advantage for me to sell back month VIX futures.  I thought this has to be an anomaly!

So I plotted a graph showing the premiums of the first seven, VIX monthly futures prices over spot VIX.  As you can see in Yellow, the rolling seventh month VIX futures prices have indeed been trading at record premiums over spot VIX.  On August 17, when spot VIX hit a five-year low of 13.45, the VIX March futures prices were trading at 93.7% premium.  Since then, VIX has climbed to 17.74, reducing the premium March 2013 VIX futures trade over spot VIX to 53.9%.  However, this premium is still very high based on historical premiums

Something does not make sense, unless...

VIX futures term-structure and the gaping spread between the seventh month VIX futures prices and the second month VIX futures prices are warning us of an impending correction.  In looking at the graph below, the peaks in the spread between VIX seventh month future price vs the VIX second month futures price has preceded 1 to 2 weeks prior to the peaks of SPY prices.  The graph below looks pretty convincing, especially when looking at how closely SPY prices have moved with the rise and fall of the price spread of VIX futures.  Is the recent peak on August 17, 2012 signaling an equity market top with prices expected to start falling any day now?!


I am not so convinced of what VIX futures term-structure is signaling...

The graph below shows that prior to SPY price corrections, the ratio of VIX to a measure of realized volatility has in recent years always been on the low side.  The blue lines in the chart below show corresponding values of the ratio of VIX over Realized Volatility right before SPY prices began falling and subsequently underwent either a minor or major correction.  Currently, however, this ratio remains at very high levels.  In other words, realized volatility has been very low recently.  More importantly, realized volatility has yet to show a rising trend.  Until I see realized volatility start to jump in SPY prices, I would remain bullish on the equity markets.


I can understand that with SPY prices at new recent highs and with tremendous expectation built in to the equity market for imminent announcement of credible European government and central bank policies, investors would want to hedge their portfolios with VIX futures.  However, the discrepancies between implied volatility and realized volatility to that of VIX futures prices seem way out of line.  Something has to give.  Perhaps buying the 2nd month VIX futures and selling the seventh month VIX futures could be a good bet if the spread between the two is expected to decrease.

Sunday, August 26, 2012

Don't Be Puzzled By A Low VIX.

On August 17, 2012, the closing value of VIX was 13.45, a level not seen since June 19, 2007 when the closing value of VIX was 12.85.  The recent lows in VIX has many naysayers talking.  Never mind the fact that SPY prices have hit new highs since May 2008.  "Such a low VIX level shows investor complacency and has been a reliable signal of market tops", claims the talking heads that are equally in disbelief that the equity market keeps going up and up.

I must admit, with all the problems unresolved in Europe, concerns over Chinese economic slowdown, and possible falling off of the fiscal cliff in the U.S., it is easy to sympathize with their arguments that this equity market has been manipulated upwards by central banks and that it is set for a free fall.

I would like to take a different perspective.  Recent earnings announcement from Cisco got me thinking.
1) that the global economy is not as weak as once feared
2) U.S. multinational companies are still enjoying the benefits of global markets reach and growth
3) S&P500 Index is more and more comprised of these multinational, global companies.

So I took IMF's global GDP growth figures and projections and plotted the long-term, monthly VIX inverse levels on top of it.  What the graph below shows is that inverse of VIX follows the annual global GDP growth rates very closely.  Perhaps this is the reason why the equity markets have continued their bull-run and VIX levels have declined to their lowest levels in years.  If the GDP projections end up close to reality, VIX could easily move within 10-20 range as it did from 2003-2006.


Perhaps, VIX falling to 13.45 level recently should be taken as a signal of an equilibrium shift in VIX levels happening before our eyes.  As you can see from the graph below, VIX has in the past moved from low volatility equilibrium to high volatility equilibrium and back and forth.  Should IMF projections for 2013 GDP growth be right in its direction, there should not be a reason to discredit the possibility that VIX has shifted to lower equilibrium levels.


If this is the case, then I must consider utilizing the Blue/Cyan median VIX levels in my models from hereon to calculate expected VIX levels, rather than using the long-term median VIX levels in Black/Grey.  I have not accepted this 100%, but I am considering making this adjustment.


One thing for certain is that VIX futures prices and VIX futures term-structure are still showing a steep contango.  One of the best bets to make throughout the past 11 months was to short front-month VIX futures as the steep premium of VIX futures prices moved to zero at expiration settlement.  I believe that shorting VIX futures would still be a good bet going forward, especially in consideration of the possibility that an equilibrium shift to low levels is now taking place.  I will continuously be looking for opportunities to short VIX futures delta by shorting VIX futures, using VIX and VXX options, shorting VXX, going long XIV, shorting VXZ, or going long ZIV as long as the contango remains steep.

Sunday, August 19, 2012

Real-Time Simulations: Update & Possible Implications


Here are latest results of my ongoing real-time simulations that show how my model and simple trading rules have been "performing".

First graph shows VIX front month trading system where I compare FVE vs VIX (in blue) for signals and FVE vs VIX futures (in pink).  As you can see since June 22nd, while the pink line has continued a steady ascent, blue-line has been coming down.

Second Graph shows updates to the Relative Value Trading rules where I compare VIX futures to a modified FVE.  Once again, since middle of June, the short-term direction of the simulated equity graph has not been good.


Finally, the third graph shows profit results (from hypothetical $20k account) of VIX 2nd/3rd month futures spread trading strategy YTD (in pink) and VXX/VXZ pairs trading strategy (in blue).  Since VIX futures spread trading strategy follows signals from FVE vs VIX futures, it's performance has not noticeably deteriorated, but VXX/VXZ strategy follows FVE vs VIX signals, thus the performance has followed it down recently.

VIX has been falling much lower than most anyone has been expecting.  What is of concern to me is not the VIX levels but rather that the trend of VIX since June 22nd has been leading the trend of realized volatility.  Remember the efficacy of my FVE model as a trading tool depends on the the key assumption holding true--that realized volatility has been leading implied volatility since 2009.


What is happening to VIX?  Based on my quantitative way of looking at VIX, it's movements have changed in character since June 22nd.  Is this just a temporary phenomenon or does it reflect a change in the longer-term structure of the markets?

Honestly, it is too early to make any conclusion, but I am aware of the possibility for structural changes taking place in the markets--as it often does every 4-5 years.  When markets undergo structural changes, trading rules that worked on the markets under old structure lose their effectiveness in the new market structure.  New trading rules would then have to be developed.

As for investors that look at VIX for making their investment decisions, should the current VIX level in the 13 range serves as an indication of things to come, we can expect a continuation of the current bull market and perhaps a shift in the volatility equilibrium more comparable to the blue and cyan lines in the fifth graph, rather than the black and grey lines (which represent long-run median VIX levels).

Once again, it is too early to make that conclusion, but we should not ignore the possibility...

Sunday, August 5, 2012

Essential Guide to Understanding & Forecasting VIX & VXX


Implied equity market volatility (as measured by VIX) is determined by a reflexive loop between the derivative and underlying markets based on future estimate of realized volatility of the underlying (S&P500 Index) + characteristic movements of the underlying. There are of course many more factors that affect the VIX--such as skew of implied volatility curve, day of the week, holidays in a given month, upcoming events that could impact the market--just to name a few.

Unlike determining the direction of stock prices, forecasting volatility can be a matter with which investors are unfamiliar.  While this may sound like a complex concept, it can be easily broken down into three parts.

I.          Forecasting Market Volatility (VIX)
II.         Understanding VIX Futures Related ETNs (VXX)
III.       Forecasting VXX Prices


I. Forecasting Market Volatility (VIX)

In a nutshell, an investor could get a good sense of whether equity market volatility or VIX is cheap or expensive based on following the analysis of 1) Various GARCH model estimates and 2) Median Curve of VIX dependent on (SPY) prices in relation to its various moving averages.

The first step involves looking at estimates of future realized volatility.  V-Lab is an excellent website to get up-to-date estimates of the future realized volatility of the S&P500 Index based on various GARCH models.  (Wikipedia is an excellent resource to understand the technical definitions of GARCH Models).  In V-Lab, click on SPX, and several analyses of S&P500 Index will show.  I like to look at EGARCH return series (just a personal preference).  The graph below is from V-Lab and shows EGARCH volatility prediction for future realized volatility of the S&P500 Index.  As of August 23, 2012, the value for 1-month prediction was 15.13%.


One should then compare this number to the At-The-Money (ATM) implied volatility level of S&P500 Index options, depending on number of days to go before expiration.  Since we have two weeks remaining to August expiration, we should average the implied volatility levels of SPY August & September 139/140 strike options, which are At-the-money.  ATM implied volatility numbers can be found in Morningstar's website under "Options" tab for SPY and the average currently stands at 14.4%.

Usually, volatility values from EGARCH model are a couple of points lower than implied volatility values of ATM options.  The reason is that investors would rather buy options than sell them, given a 50/50 outcome of a gain vs. a loss, because the potential payout of unlimited gain and limited risk is far more attractive.  Furthermore, if the EGARCH model estimate of 15.13% proves to be accurate, options theory tells us that one could purchase an ATM options straddle at 14.4% volatility level and dynamically scalp deltas at 15.13% volatility level for a small, but riskless profit.  Commissions, slippage and other costs could make this trade less attractive, but these costs are very low for market makers.  To market makers, the current situation would be like owning almost free options, and almost free options are always a good to own.  Based on realized (future estimate) volatility analysis, I would say that current implied volatility levels are undervalued.

The second step is to look at median values of VIX dependent on where SPY prices are relative to its various moving averages because changes in VIX are dependent not only in the volatility of SPY prices, but also in how comfortable investors are about the 
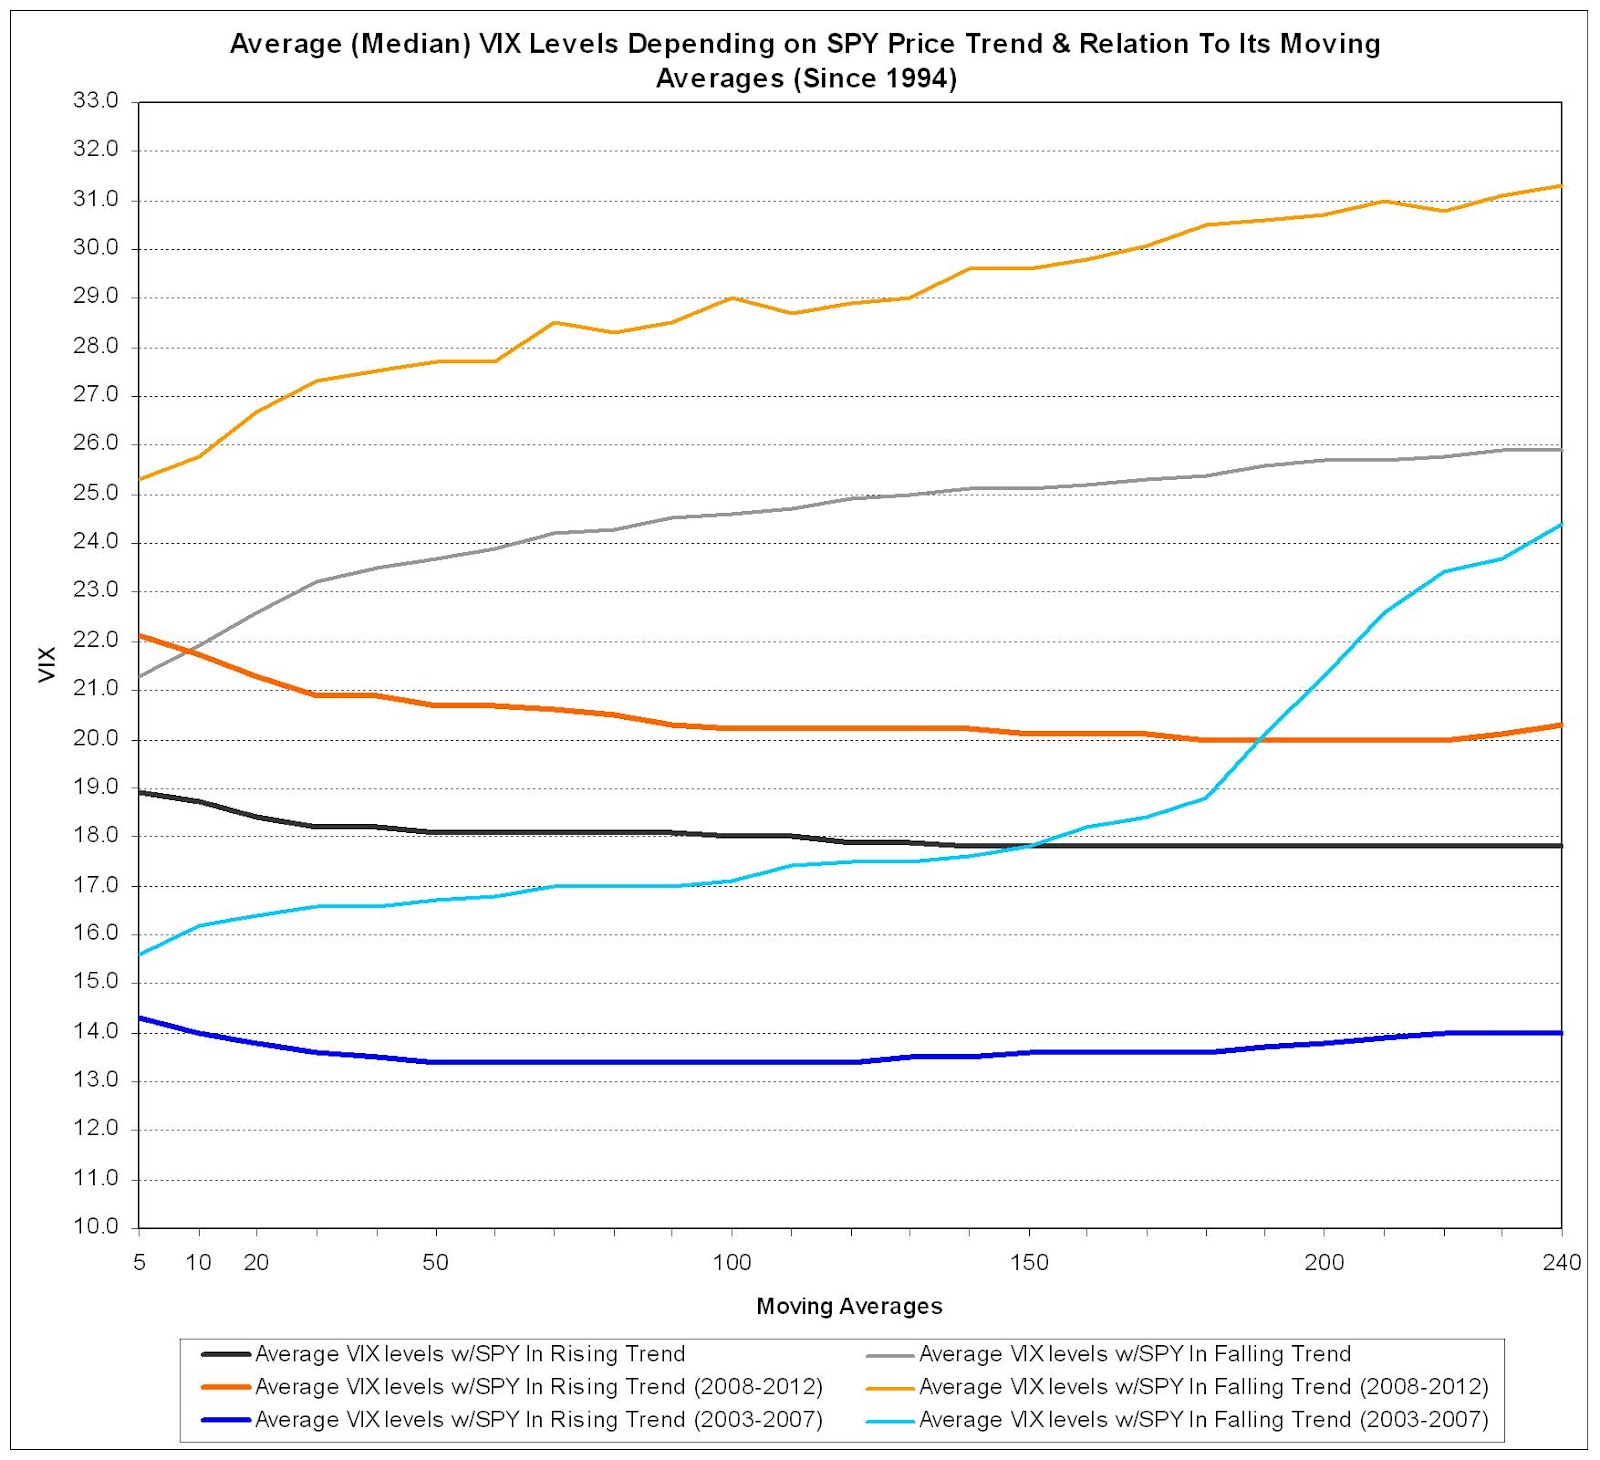
market.  The chart below shows analysis that I conducted.  Median values represent 50/50 probability of VIX being above or below a specified level based on historical data.


For example, since 1994, shown in black & grey, when SPY prices were in an up trend and above its moving averages, the median VIX levels were around 18%.  On the other hand, when SPY prices were in correction and below its moving averages, the median levels were between 22-26%.  I would say that the 20-day, 50-day, & 200-day moving averages are most widely followed.

I also included two other plots showing "distinct" periods when VIX remained high or low for extended periods of time.  Between 2003-2007, shown in blue & cyan, VIX levels remained low.  The median VIX level when SPY prices were above its moving averages was around 13.6%, while when SPY prices were below its moving averages, median VIX levels ranged from 16.4-24.4%.  On the other hand, between 2008-2011, shown in red & orange, VIX levels remained high. The median VIX levels during this period were 20.5% and 26-31%, respectively.  I believe the long-term median VIX values in black & grey are befitting to the recent market environment in 2012

If we look at the current graph of SPY below, SPY closed on August 3, 2012 at 139.35 and remains above all moving averages and is moving within a clearly defined uptrend.  Based on median VIX value analysis, I would think VIX levels around 17 would be considered “fair value”.  VIX closed at 15.64 on August 3rd, therefore, probability analysis also confirms that current VIX level is undervalued.


Finally, the third chart below shows the graph of VIX relative to my custom built, Fair Volatility Estimate (FVE) Indicator.  FVE takes into calculation 1) the future realized volatility estimate and 2) characteristic movements of SPY, as well as other factors, in a visually simple indicator. According to FVE, VIX remains below FVE’s value of 18.9 and thus visually illustrates the conclusions we drew from the two separate analyses above that VIX remains “undervalued”.


Now that we have walked through this process and determined that VIX is indeed undervalued based on 1) estimate of future realized volatility and 2) historical probability, how can we make money off of this analysis?

II. Understanding VIX Futures Related ETNs (VXX)

Unfortunately, VIX is not an instrument one could realistically trade.  There are instruments that have been created based on VIX futures, but these instruments have complex idiosyncrasies of their own.  Let us look at iPath S&P500 VIX short-Term Futures ETN (VXX) because it is by far the most popular VIX-related instrument available to retail investors.

VXX is designed to replicate, net of expenses, the S&P 500 VIX Short-Term Futures Total Return Index.  Basically, what this means is that VXX holds in its portfolio a combination of front month and second month VIX futures positions in order to maintain a constant 1-month forward VIX futures positions.  For example, at the start of a new expiration month (say August), VXX would be holding nearly 100% August VIX futures in its portfolio.  With two weeks to go to expiration, VXX would be holding roughly 50% August VIX futures and 50% September VIX futures.  As August expiration approaches, VXX would be holding closer to 100% September VIX futures position.  The daily performance of VXX would be similar to the weighted average daily price changes of the first two monthly VIX futures positions.

Many investors who thought VXX was a good instrument to buy and hold or use it as a hedge against rising volatility have suffered considerable losses.  Mainly, this is because of the cost of carry as a result of contango in the very futures instruments that VXX holds in its portfolio.  Contango means that each subsequent expiration month of VIX futures prices are trading higher than the closer month’s VIX futures prices and the spot VIX overall (upward sloping curve).  The effects of contango on VXX can be seen visually in the graph below.  The graph shows the average premium the front month and second month VIX futures trades over spot VIX over time, along with cumulative average cost per month that puts significant downward pressure on VXX prices.


When in contango, VIX front month futures (in blue) on average start off 10% higher than the spot VIX with 21 trading days to go before expiration.  As expiration approaches, this premium goes to zero.  Likewise, VIX second month futures (in red) on average start off 15% higher than spot VIX.  The premium on this goes down as well as time passes.  The net effect (shown in Green) is that VIX futures contango has reduced on average the price of VXX by 6.5% per month!

Remember, when VIX rises above 25 level, VIX futures usually goes into backwardation.  Backwardation can be understood as the opposite phenomenon as contango.  Backwardation begins to happen when Spot VIX is higher than front month VIX futures, and complete backwardation occurs (very rarely) when VIX futures prices of each subsequent expiration month is lower than the price of VIX futures in expiration months that are closer (downward sloping curve).  When VIX futures are in backwardation, VXX prices would theoretically rise as time passes, even if spot VIX were to remain constant.

To test the accuracy of how contango affects VXX prices, I plotted VXX prices from the beginning of 2012 and compared this to the theoretical VXX price taking into account the daily price change of VIX less the average daily cost burden from VIX futures contango.  As you can see over time, theoretical VXX prices mirrored actual VXX prices as shown in the graph below.


As a rule of thumb, from the beginning of a new expiration month, the average daily cost from contango has been 0.25% for each trading day.  With 5 days to go before expiration, however, the cost has jumped to 0.45% for each trading day.  More appropriate way of looking at this is on a weekly basis.  With 4 weeks to go before expiration, the effects of contango has eaten away on average 1.25% from the price of VXX each passing week, but during the final week 2.25% has been chomped off!


III. Forecasting VXX Prices

Now that we have understood what VXX is and how contango affects the price of VXX, let us revisit our VIX forecast from above and translate this into a forecast for VXX prices.  Let us assume that fair value of VIX is around 18 level, and VIX will rise to 18 sometime in the next two weeks before August VIX Expiration.  As long as SPY prices continue to trade within its rising channel, VIX is expected to fluctuate from 16-19 level for the next two weeks as well.  VIX August futures price closed at 17.20, and VIX September futures price closed at 19.40 on August 3rd.

If VIX were to rise to 18 level one week from now (15.1% higher from 15.64 level), VIX August & September Futures prices could be expected to trade around 18.85 & 20.25, respectively, according to the average premiums VIX futures trade over spot VIX when in contango with 7 trading days to go before expiration.  Calculating for the weighted average rise in VXX’s portfolio of VIX August & September futures positions, VXX is then expected to rise 6.9% to 13.0 from August 3rd closing price of 12.16.  Following the same methodology, if VIX were to rise to 18 level right before August expiration (slightly over two weeks from now), VXX is expected to be trading around 12.55, or just 3.0% higher than August 3rd closing price!  Finally, if VIX were to move within 16-19 range until VIX August expiration, VXX prices could trade between 11.15 to 13.70.  Please consider how different VXX moves in comparison to spot VIX and understand how important it is to not only to forecast VIX but to carry out analysis to forecast VXX when one wants to trade volatility instruments.

A superior risk adjusted trading strategy to execute based on the above forecasts would be to buy August VIX futures while simultaneously selling September VIX futures as a spread.  The logic behind this trade is that the front month futures would rise a greater percentage than the second month futures if VIX were to rise as expected, but at current price levels, the spread is not expected to lose much if VIX does not rise.  Another strategy would be to sell the VXX August monthly 13/14 call spread and sell the VXX 12 puts for close to 0.70 credit, which should generate a profit if spot VIX moves within our forecast, but should VXX fall close to 11 level, it would be worth owning VXX outright for a short-time to recover any losses from this options spread.

By: Steven Lee

Senior Options Instructor for Trading Advantage, LLC www.tradingadvantage.com

Disclosure:  I am slightly long VXX and because VXX is an instrument to trade, I could exit out of this position in the next 72 hours.

Sunday, July 22, 2012

VIX Has Remained Undervalued For Longer Than Expected.

VIX has remained surprisingly undervalued despite negative economic reports and not so strong earnings announcements thus far.  I understand that since beginning of June, the market has been rallying.  As long as this rising trend continues (as shown in blue lines), I would expect VIX to be subdued.  However, I was surprised that VIX didn't even touch the 20 level when SPY tested the 133 level back on July 12th.

On Friday, Spain reared its ugly head again and negative headlines are popping up about Greece AGAIN in overnight session.  Depending on AAPL earnings results and ongoing developments in Europe, I would not be surprised if SPY tests its support line again (around 134.5 level this time), but this time with higher probability of the support failing due to the fact that SPY and the VIX have priced in potentially positive news and shrugging off actually negative news.  Yes, I know this can be considered a bullish sign, but that was the case over a month ago, when expectations were really negative but price action quite positive.  That is no longer the case.

Rule of Thumb Analysis on Cost of Carry for VXX

Interest in VIX and VIX futures-related ETFs & ETNs have grown exponentially over the past few years.  Unfortunately, understanding of VIX futures-related ETNs, such as the most popular iPath S&P500 VIX Short-Term Futures ETN (VXX), has not kept up with the explosion of its trading.

For many who thought VXX was a good instrument to buy and hold, as a hedge against rising volatility, have suffered considerable losses.  Mainly, this is because of the cost of carry in the very futures instruments that VXX holds in its portfolio.

VXX is designed to replicate, net of expenses, the S&P 500 VIX Short-Term Futures Total Return Index. Basically, what this means is that VXX holds in its portfolio a combination of front month and second month VIX futures positions in order to maintain a constant 1-month forward VIX futures positions.  For example, at the start of a new expiration month (say August), VXX would be holding nearly 100% August VIX futures in its portfolio.  Two weeks to go to expiration, VXX would be holding roughly 50% August VIX futures and 50% September VIX futures.  As August expiration approaches, VXX would be holding closer to 100% September VIX futures position.  The daily performance of VXX would be similar to the weighted average daily price changes of the first two month VIX futures positions.

VIX futures are almost always in contango.  Contango means that each subsequent expiration month of VIX futures prices would be trading higher than the closer month's VIX future prices and the spot VIX overall (upward sloping curve).  The top graph (in blue) shows the average premium that VIX front month futures trades over Spot VIX with X number of days to go before expiration.  The red line shows the average premium that VIX second month futures trades over Spot VIX.  Finally, the Green line shows the daily average cumulative cost that VXX incurs to its portfolio by selling the front month VIX futures and buying second month VIX futures on a daily basis.  The average monthly cost that VXX incurs is around 6.5%.  This means that on any given month, even if VIX were to remain constant, VXX price would fall by 6.5% when VIX futures prices are in contango.

Remember, that when VIX rise above 25, VIX futures usually goes into backwardation.  Backwardation can be understood as the opposite situation as contango.  Backwardation begins to happen when Spot VIX is higher than front month VIX futures, and complete backwardation occurs (very rarely) when VIX futures prices of each subsequent expiration month is lower than the price of VIX futures in expiration months that are closer (downward sloping curve).  When VIX futures are in backwardation, VXX prices would theoretically rise as time passes, even if spot VIX were to remain constant.

As a rule of thumb, from the beginning of a new expiration month, for each trading day VXX could fall on average 0.25% as a result daily roll cost from contango.  With 5 days to go before expiration, VXX could fall on average 0.45% each trading day.  Another way of looking at this is on a weekly basis.  With 4 weeks to go before expiration, the cost of daily roll from contango could be seen as 1.25% for each passing week, but during the final week before expiration, the cost of daily roll increases significantly to 2.25% for the week!

The second graph above plots the actual VXX prices (in red) since the beginning of 2012.  The black line represents theoretical VXX price taking into account the daily price change of VIX less the average daily cost of carry for VXX as calculated from this analysis.  As you can see, while the black line does not move exactly to actual prices of VXX, on a weekly and monthly basis, it moves very similar to actual VXX prices.

Tuesday, July 10, 2012

Should SPY Fall Below 133 Level, Expect VIX To Jump 23 level.

 SPY closed at 134.14 on July 10, 2012, right at its 20-day moving average.  VIX closed at 18.72.  Remember the chart of VIX median values from the previous post.  When SPY is in an uptrend and above its major moving averages, the median value or 50/50 probability line of VIX is around 18%.  The median value of VIX jumps to 22%-23.5% when SPY trades below its 20-day & 50-day moving averages.

FVE has stopped declining and has begun to rise again and currently stands at 20.89 compared to VIX of 18.72.  As long as SPY remains above 133 level, I believe investors would still believe that the current rebound would continue (hence VIX to remain below 20 level).  Should 133 support level fail to hold, I would expect SPY to test its 200-day moving average again and expect VIX to climb to 23 level.

Wednesday, July 4, 2012

Probability Analysis of VIX (in greater detail)

In the previous post "Assumptions Behind FVE Model", I wrote that implied volatility is a reflexive function of realized volatility of the underlying + statistical relationships on supply & demand of options based on characteristic movement of the underlying.  Basically, an investor could get a good sense of the "appropriate" value of VIX based on the analysis of 1) realized (future estimate) volatility & 2) characteristic movement of the underlying.  I am going to walk through this process.

First, using various GARCH models, one could calculate an annualized volatility number of the future volatility of the underlying from 1 week to 1 month out.  In the case of S&P500 Index, the following link (http://vlab.stern.nyu.edu/analysis/VOL.SPX:IND-R.EGARCH) provides updated values from several GARCH models.  The first chart in this post shows these numbers in graph form from one of the models.  The latest value is 15.68%.  One should then compare this number to the At-The-Money (ATM) implied volatility level of July/August S&P500 Index option, depending on days to go before expiration.  July ATM implied volatility is around 14% while August ATM implied volatility is around 15%.

Based on realized (future estimate) volatility analysis, I would say that current implied volatility levels are low or undervalued.  Usually, volatility values from various GARCH models are lower than ATM implied volatility values.  The reason is that investors would rather buy options than sell them, given a 50/50 outcome of a gain vs a loss, because the potential payout of unlimited gain and limited risk is far more attractive.  Furthermore, if the EGARCH model estimate of 15.68% proves to be accurate, options theory tells us that one could purchase ATM options at an average14.5% implied volatility level and dynamically scalp deltas at 15.68% volatility level for a theoretical profit.  Of course, commissions, slippage, and other costs would come into play, but these costs are very low for market makers.  To them, the current situation would be like owning free options, and free options are always good...should the EGARCH model estimate prove to be accurate.

Second, I have calculated the median values of VIX dependent on where the SPY ETF price is relative to its various moving averages since 1994.  As shown in the second chart (in black & grey), the median value (50/50 probability) for VIX when SPY is above its moving averages is around 18%, while it ranges from 22-26% depending on whether SPY has fallen below its corresponding moving averages.  I would say the 20-day, 50-day, & 200-day moving averages are most widely used.  I have also included two other "distinct" periods when VIX remained high or low for an extended period of time.  Between 2003-2007, VIX remained very low, with median VIX levels around 13.6% during SPY rising trend and 16.4-24.4% during SPY falling trend (shown in blue & cyan).  On the other hand, between 2008-2011, VIX remained very high with corresponding median VIX levels of 20.5% and 26-31% (shown in red & orange).  I believe the long-term median values in black & grey are more befitting to the current market environment in 2012.  Based on probability analysis, current VIX value of 16.6 is low compared to 18% median value.

Finally, the third chart above shows graph of VIX relative to FVE.  As described in the previous post, FVE takes in to calculation realized volatility and characteristic movement of SPY, as well as other factors.  According to FVE, VIX is clearly undervalued.

However, an investor must always consider that models, even the best ones, do not predict outcomes, but only try to calculate expected or more likely outcomes.  As in Texas Holdem, even with a 90% probability of winning the hand, one could lose everything especially if one bet all-in.  Calculating appropriate VIX levels in the methodology described above is still much more of a challenge.