Here are latest results of my ongoing real-time simulations that show how my model and simple trading rules have been "performing".


VIX has been falling much lower than most anyone has been expecting. What is of concern to me is not the VIX levels but rather that the trend of VIX since June 22nd has been leading the trend of realized volatility. Remember the efficacy of my FVE model as a trading tool depends on the the key assumption holding true--that realized volatility has been leading implied volatility since 2009.

What is happening to VIX? Based on my quantitative way of looking at VIX, it's movements have changed in character since June 22nd. Is this just a temporary phenomenon or does it reflect a change in the longer-term structure of the markets?
Honestly, it is too early to make any conclusion, but I am aware of the possibility for structural changes taking place in the markets--as it often does every 4-5 years. When markets undergo structural changes, trading rules that worked on the markets under old structure lose their effectiveness in the new market structure. New trading rules would then have to be developed.
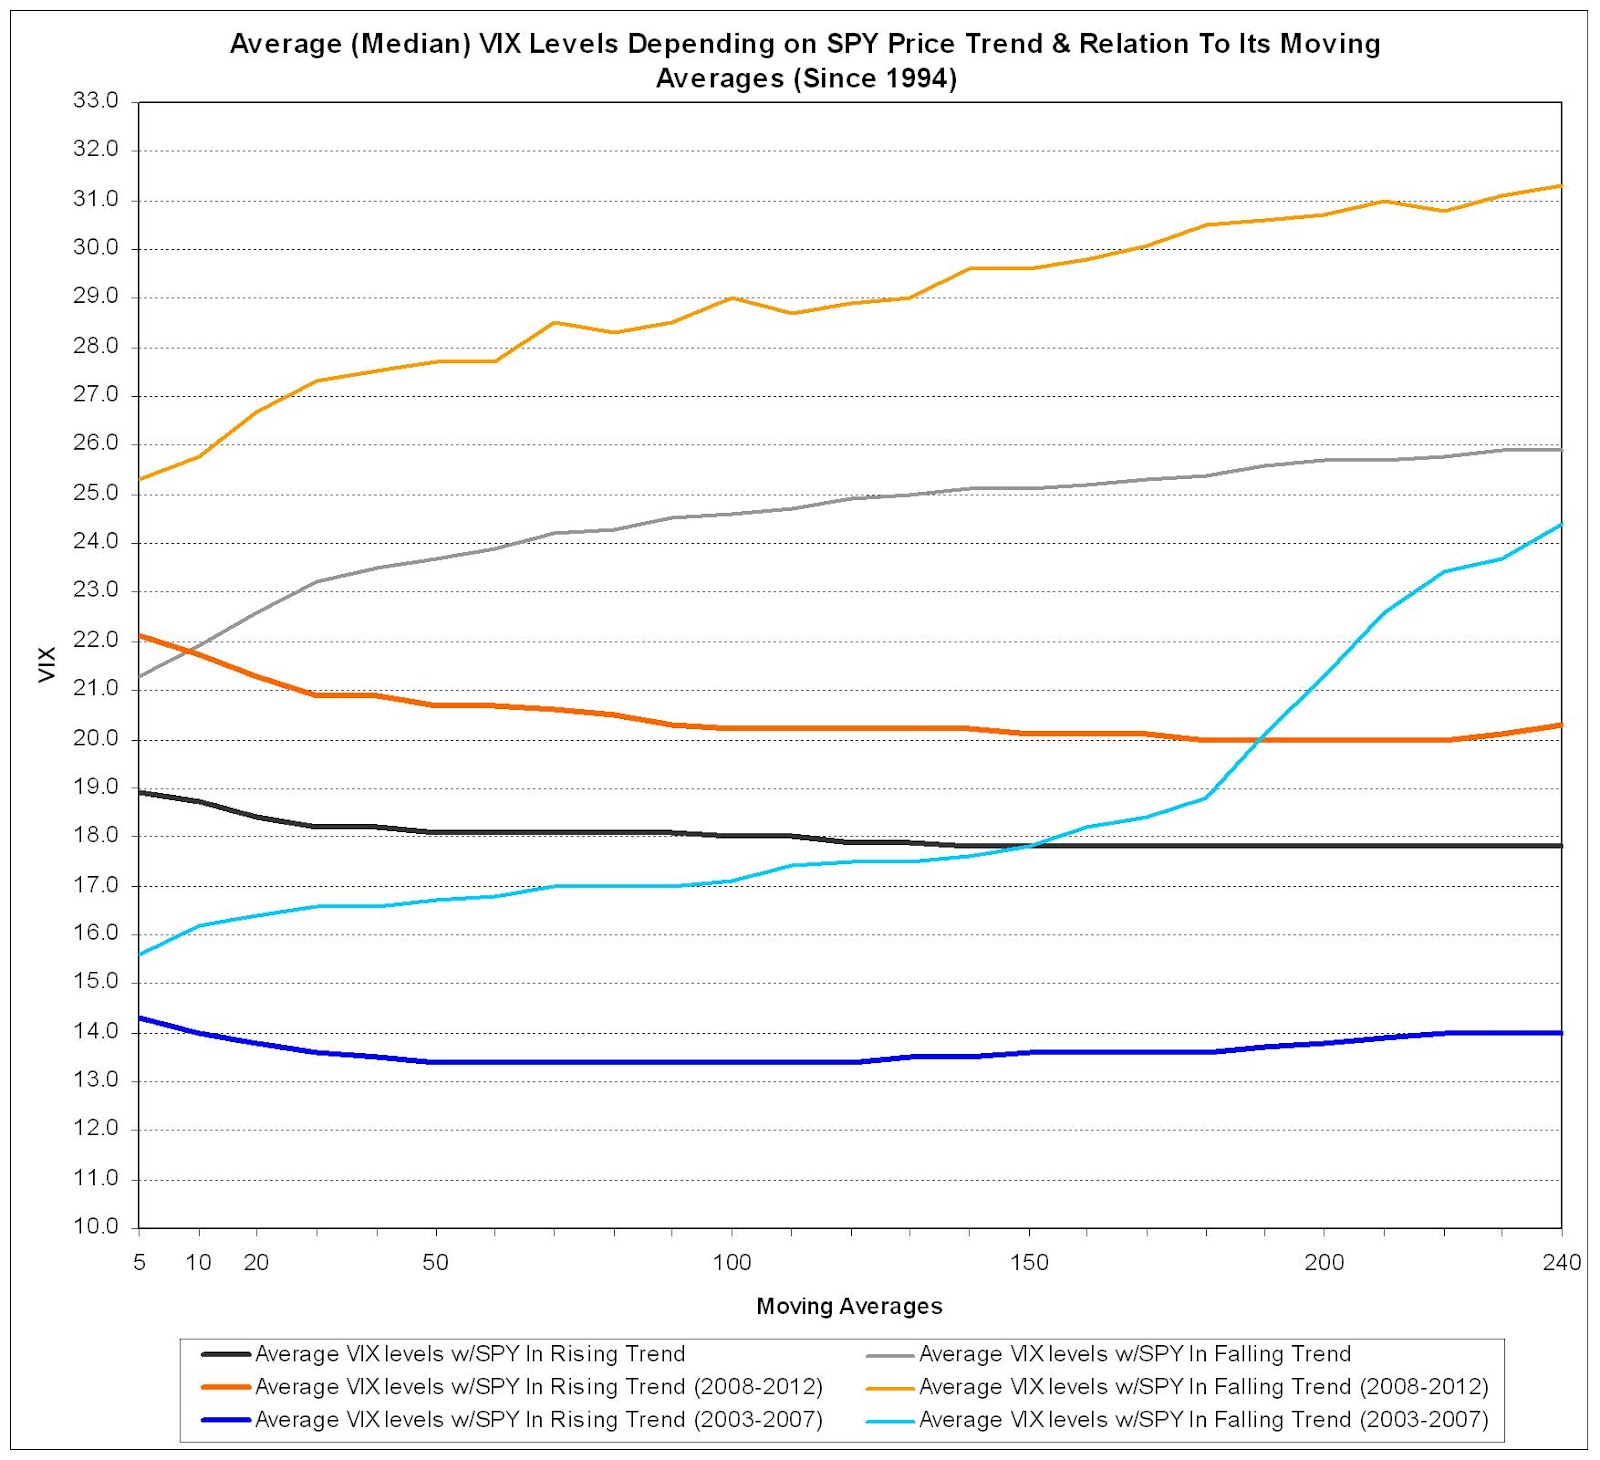
As for investors that look at VIX for making their investment decisions, should the current VIX level in the 13 range serves as an indication of things to come, we can expect a continuation of the current bull market and perhaps a shift in the volatility equilibrium more comparable to the blue and cyan lines in the fifth graph, rather than the black and grey lines (which represent long-run median VIX levels).
Once again, it is too early to make that conclusion, but we should not ignore the possibility...
I see the decline in the VIX as a result of:
ReplyDelete1. Weeklies -> Shift from mid-to-long term options to weeklies (increased fear). Weeklies are also not used in calculating the VIX.
2. Decrease in overall volume of options, but disproportionately, with PUT volume decreasing more so than CALL volume. Many traders bought protective PUTs for the Greece, Spain, Italy, China, Eurozone, take-your-pick fear, expecting to make it big (or at least be protected), only to see their options expire worthless, now they have taken their money (what they have left) off the table. This lead to an overall decline in demand -> decline in implied volatility.
3. Decline in overall market volume. Large institutional investors are holding more cash, buying less stock. The market is moving up on low volume.
You might try graphing (VIX)/(X-Day MovAvg of VIX) volume adjusted.
Dominic. Thanks for your observations. Weekly SPX options have been trading for awhile now so I'm not sure why it would be affecting VIX through the lens of my models. Definitely something to consider, though...
ReplyDeleteAlso, how do you graph volume adjusted VIX? Thanks.