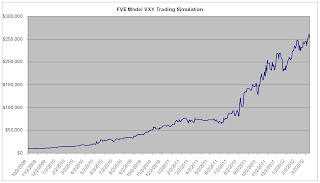
- Hypothetical Simulation using a $10,000 Account, long/short, no leverage used. October 1, 2009 to March 15, 2012. Slippage 0.07, $15 commissions per trade.
- Trading simulations based on VXX showed similar but slightly less results than simulations done on front month VIX-futures. VXX 301% annualized returns vs VIX Futures 344% annualized returns. Peak to Trough drawdown on daily equity graph of 18.4%, however, was better in VXX simulation. In VIX futures simulation, the comparable figure was 22.8%. Calmar's Ratio for VXX: 301/18.4 = 16.36. Calmar's Ratio for Vix Futures: 331/22.8 = 14.52. So, on a risk adjusted basis, VXX trading strategy appears slightly superior.
Disclaimer
Disclaimer: The information found on this site is meant for educational and informational purposes only. Nothing on this site should be construed as a recommendation or solicitation to buy or sell derivatives or securities or to trade any particular strategy. Trading of derivatives or securities has large potential risk and you must be aware of and accept all the risks. Past performance of any trading system or methodology is not necessarily indicative of future results. No representation is being made that any account will or is likely to achieve performance results similar to those discussed on this website. Hypothetical or simulated performance results have certain limitations and do not represent actual trading.

No comments:
Post a Comment