This is a graph since 1/1/2007 of VIX (black) & FVE (red). I drew a ZigZag line (green) to show that recently FVE is showing a higher low. I also drew circles in instances where FVE was below 20 and had a higher low after seeing lower lows.
We are seeing surprisingly low volatility in the S&P500 Index movements, but FVE had remained for the most part below VIX since November 2011, until just recently. Of course, VIX can remain at low levels or go even lower. FVE's higher low, however, is showing that a VIX spike is likely and not too far away.
Disclaimer
Disclaimer: The information found on this site is meant for educational and informational purposes only. Nothing on this site should be construed as a recommendation or solicitation to buy or sell derivatives or securities or to trade any particular strategy. Trading of derivatives or securities has large potential risk and you must be aware of and accept all the risks. Past performance of any trading system or methodology is not necessarily indicative of future results. No representation is being made that any account will or is likely to achieve performance results similar to those discussed on this website. Hypothetical or simulated performance results have certain limitations and do not represent actual trading.
Sunday, March 25, 2012
Thursday, March 15, 2012
Trading VXX Using FVE Model
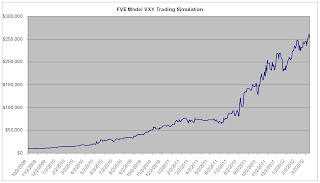
- Hypothetical Simulation using a $10,000 Account, long/short, no leverage used. October 1, 2009 to March 15, 2012. Slippage 0.07, $15 commissions per trade.
- Trading simulations based on VXX showed similar but slightly less results than simulations done on front month VIX-futures. VXX 301% annualized returns vs VIX Futures 344% annualized returns. Peak to Trough drawdown on daily equity graph of 18.4%, however, was better in VXX simulation. In VIX futures simulation, the comparable figure was 22.8%. Calmar's Ratio for VXX: 301/18.4 = 16.36. Calmar's Ratio for Vix Futures: 331/22.8 = 14.52. So, on a risk adjusted basis, VXX trading strategy appears slightly superior.
- Trading simulations based on VXX showed similar but slightly less results than simulations done on front month VIX-futures. VXX 301% annualized returns vs VIX Futures 344% annualized returns. Peak to Trough drawdown on daily equity graph of 18.4%, however, was better in VXX simulation. In VIX futures simulation, the comparable figure was 22.8%. Calmar's Ratio for VXX: 301/18.4 = 16.36. Calmar's Ratio for Vix Futures: 331/22.8 = 14.52. So, on a risk adjusted basis, VXX trading strategy appears slightly superior.
Monday, March 12, 2012
VIX & VIX Futures Undervalued
VIX is now below all three FVE indicators. VIX Futures is also 12% below FVE Futures indicator, which is highly unusual. There are 8 days until VIX expiration and the risk would be that VIX Futures continues to fall rather than VIX rise. But probability favors being long now.
Friday, March 2, 2012
FVE Indicators Creeping Up

Volatility has been fairly flat for the week. While VIX remains well below 20, VIX Futures have been reluctant to fall below the 20 level. FVE indicators, however, are now slowly rising and since VIX & VIX Futures are at "fair value" to FVE2 & FVEF indicators, the model has signaled to exit short positions.
For others that are on a similar path...
As for my continued efforts to secure a meaningful opportunity to access capital to trade my FVE model, I have faced much frustration thus far. More and more people I meet are very impressed with my volatility model, but one prop trading firm only wants day traders with 3 year record. Another prop trading firm thought my strategies were too volatile for their taste (Of course any strategy with 100%+ return potential would also have higher drawdowns than say a strategy with 20% return potential). Still other prop trading firms are still only looking to hire quants. Does a mathematics or programming expertise really trump keen market insight and experience as a trader or someone that already has a unique model that can be implemented today to generate profits?
Still, the live account is up over 45% since 11/16/2011, and I figure it's only a matter of time before my model draws greater interest. I have also found that rewriting my report has helped explain my model and trading strategies in a clear and easy to understand manner.
Another area where I believe my Fair Volatility Estimate (FVE) model can add value is in quantitative portfolio allocation. Alpha = Due Diligence + Time +VOLATILITY. I have begun to send resumes to High Net Worth Investment Advisory firms that recommend portfolio structured around alternative investments. I believe my FVE model can help to reduce risk when risk of loss is greatest (volatility spikes and correlations converge to 1).
Subscribe to:
Comments (Atom)


