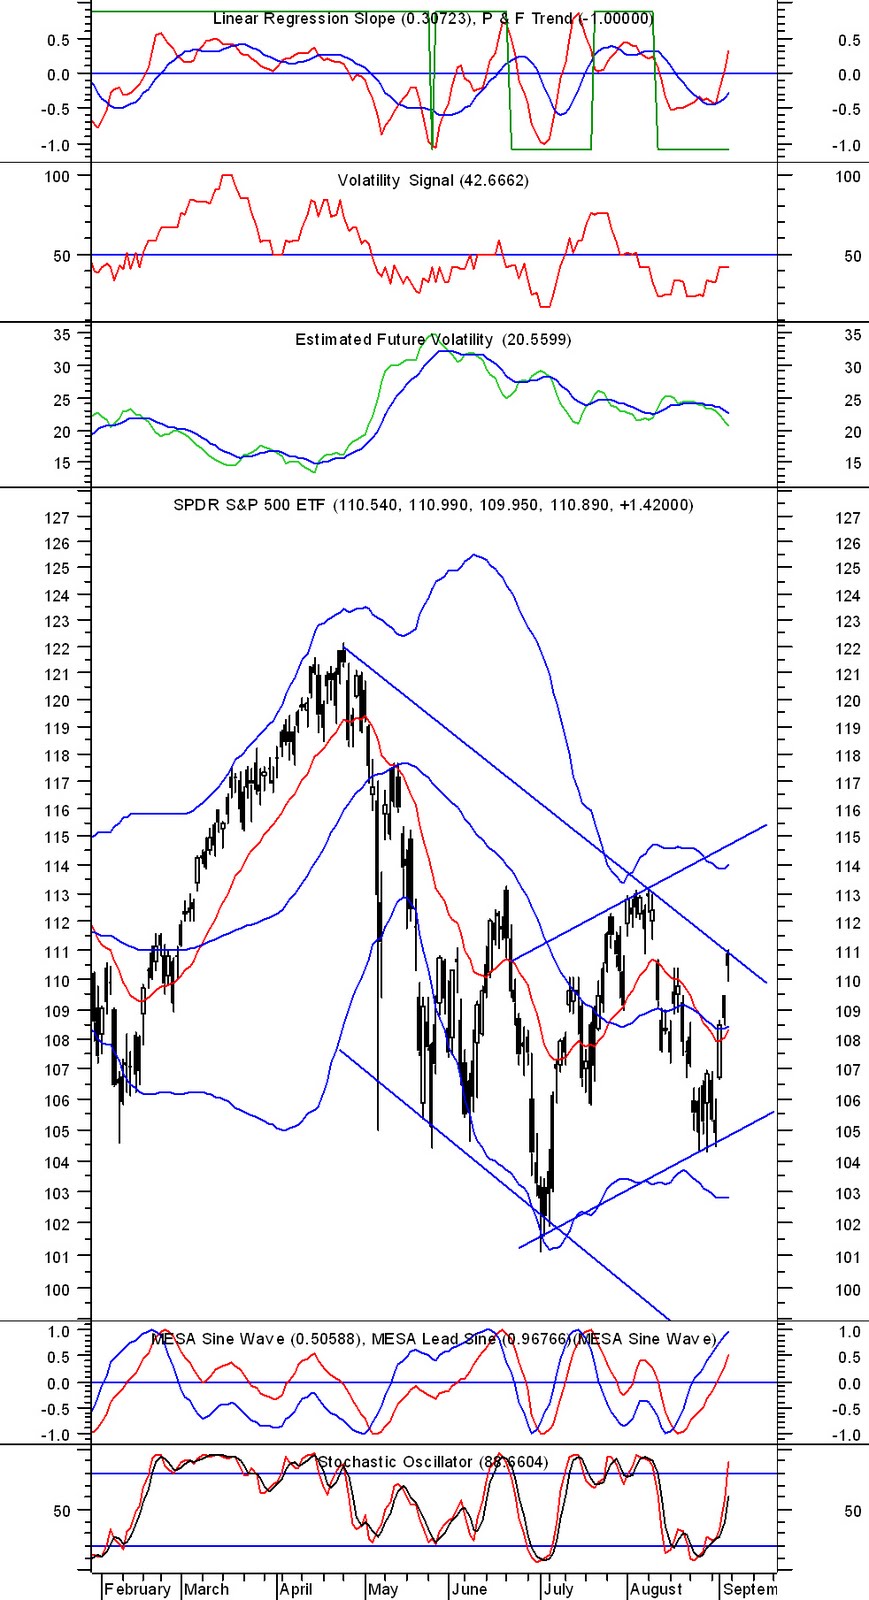
- I have devised a custom indicator using just daily price data to try to come up with theoretical value for at-the-money, 30-day implied volatility of SPY. This indicator can be used intraday with real-time price data as well. I call this indicator Fair Volatility Estimate (FVE). The chart shows the values of the FVE indicator vs. actual 30-day ATM implied volatility data of SPY, obtained from LiveVol Pro.
 - I had named the FVE indicator previously as the Estimated Future Volatility Indicator, but that is not appropriate. The correlation of my FVE indicator value to actual implied volatility data is 0.9115. If we offset implied volatility data 1 day forward, the correlation declines to 0.8799, 2 days forward the correlation is 0.8523, while 1 day backwards correlation is 0.9196 and 2 days backwards is 0.9079. So, the FVE indicator is not a predictive indicator of future implied volatility. But I believe the FVE indicator is a good measure of what implied volatility "should or may be"...and of course, implied volatility on options implies what options market is expecting future realized volatility to be.