Disclaimer

Disclaimer: The information found on this site is meant for educational and informational purposes only. Nothing on this site should be construed as a recommendation or solicitation to buy or sell derivatives or securities or to trade any particular strategy. Trading of derivatives or securities has large potential risk and you must be aware of and accept all the risks. Past performance of any trading system or methodology is not necessarily indicative of future results. No representation is being made that any account will or is likely to achieve performance results similar to those discussed on this website. Hypothetical or simulated performance results have certain limitations and do not represent actual trading.

Friday, September 17, 2010

Fair Volatility Estimate Indicator for SPY

- I have devised a custom indicator using just daily price data to try to come up with theoretical value for at-the-money, 30-day implied volatility of SPY. This indicator can be used intraday with real-time price data as well. I call this indicator Fair Volatility Estimate (FVE). The chart shows the values of the FVE indicator vs. actual 30-day ATM implied volatility data of SPY, obtained from LiveVol Pro.

- I had named the FVE indicator previously as the Estimated Future Volatility Indicator, but that is not appropriate. The correlation of my FVE indicator value to actual implied volatility data is 0.9115. If we offset implied volatility data 1 day forward, the correlation declines to 0.8799, 2 days forward the correlation is 0.8523, while 1 day backwards correlation is 0.9196 and 2 days backwards is 0.9079. So, the FVE indicator is not a predictive indicator of future implied volatility. But I believe the FVE indicator is a good measure of what implied volatility "should or may be"...and of course, implied volatility on options implies what options market is expecting future realized volatility to be.

Thursday, September 16, 2010

SPY & TLT Daily Chart w/Today's Intraday Prices


- As expected in my 9/13 posting, SPY is moving sideways in a very tight range. Economic indicators announced this week thus far have been overall supportive of the market, but have come in mostly in expected range.
- All indicators are still in bullish territory, but I am raising my stops to 111.5 and 109.5, respectively.
-There is something significant going on in the long-term bond market. Yields are rebounding quickly & bond prices, as reflective by TLT ETF are dropping quickly. If money is coming out of bond market because of improving economy expectations, that would be supportive of the stock market and would push SPY higher, above 113.2 resistance.
-However, if long-term bond yields are rising because of higher uncertainty and growing concerns of U.S. government borrowing capacity, this would not be supportive of the stock market.
- SPY implied volatility is at 20 and ETF indicator is at 19.6. I would go neutral vol and be ready to adjust positions when SPY move out of 111.55 - 113.35 range.

Monday, September 13, 2010

SPT Daily Chart w/Today's Intraday Prices


- SPY continues its rapid rise this morning. 11-day Linear Regression Slope is at 0.68 and Stochastic Oscillator is at overbought levels. Considering 113.2 was top of previous two high points, we could very well see SPY take a breather or even fall this week.
- This is Quadruple witching week, and many key economic indicators are going to be announced this week, as well. The markets are expecting these numbers to be supportive of the view that U.S. economy would not experience a double-dip recession.
- Conventional thinking would be that in expiration week with many economic indicators being announced, we could see volatile price movements. Since SPY implied vol is at 19 vs 19.8 value for EFV indicator, now may be an appropriate time to go long volatility. Well, unless economic numbers are much worse than expected, I don't see a significant move to the downside. If they are much better than expected, the rally may continue, but since SPY has come up so far, so quick, I do not see the violent move upwards either.
- I am going to remain long delta and NOT long volatility because my indicators are telling me to do so. But I am going to raise my stop/level to 110.0 and 108.9.

Thursday, September 9, 2010

SPY Daily Chart w/Today's Intraday Prices


- SPY is in the midst of a very quick move upwards. I'd have preferred SPY move sideways this week before breaking above trendline resistance. SPY is 111.2 level at this moment, and there is always the chance that today's intraday breakout is false and we'll close below the resistance trendline, but all indicators are pointing to probability that SPY would move higher.

- I would buy the remaining 1/2 long delta position 111.2. 109.5 would be my 1st stop/loss consideration. 108.5 would be where I get out of all current long delta position.

- EFV value is 20.3 and SPY implied volatility is 20.

Wednesday, September 8, 2010

SPY Daily Chart w/Today's Intraday Prices


- SPY is 110.5 at this moment, which is right at the top resistance line. Last Friday, I recommended to go long delta 1/2 position should SPY fall this week. I went long at 110.0. I would go long the remaining half either below SPY 109 or above closing price of 110.6. My first stop/loss level would be 106.9.
- If SPY closes up today, the Volatility Signal would cross above 50, turning bullish as well, confirming Linear Regression Slope and EFV indicator, which turned bullish last week.
- Implied Volatility in SPY is 22, while EFV indicator is at 20.4. I would not be long volatility at this point.

Friday, September 3, 2010

SPY Daily Chart


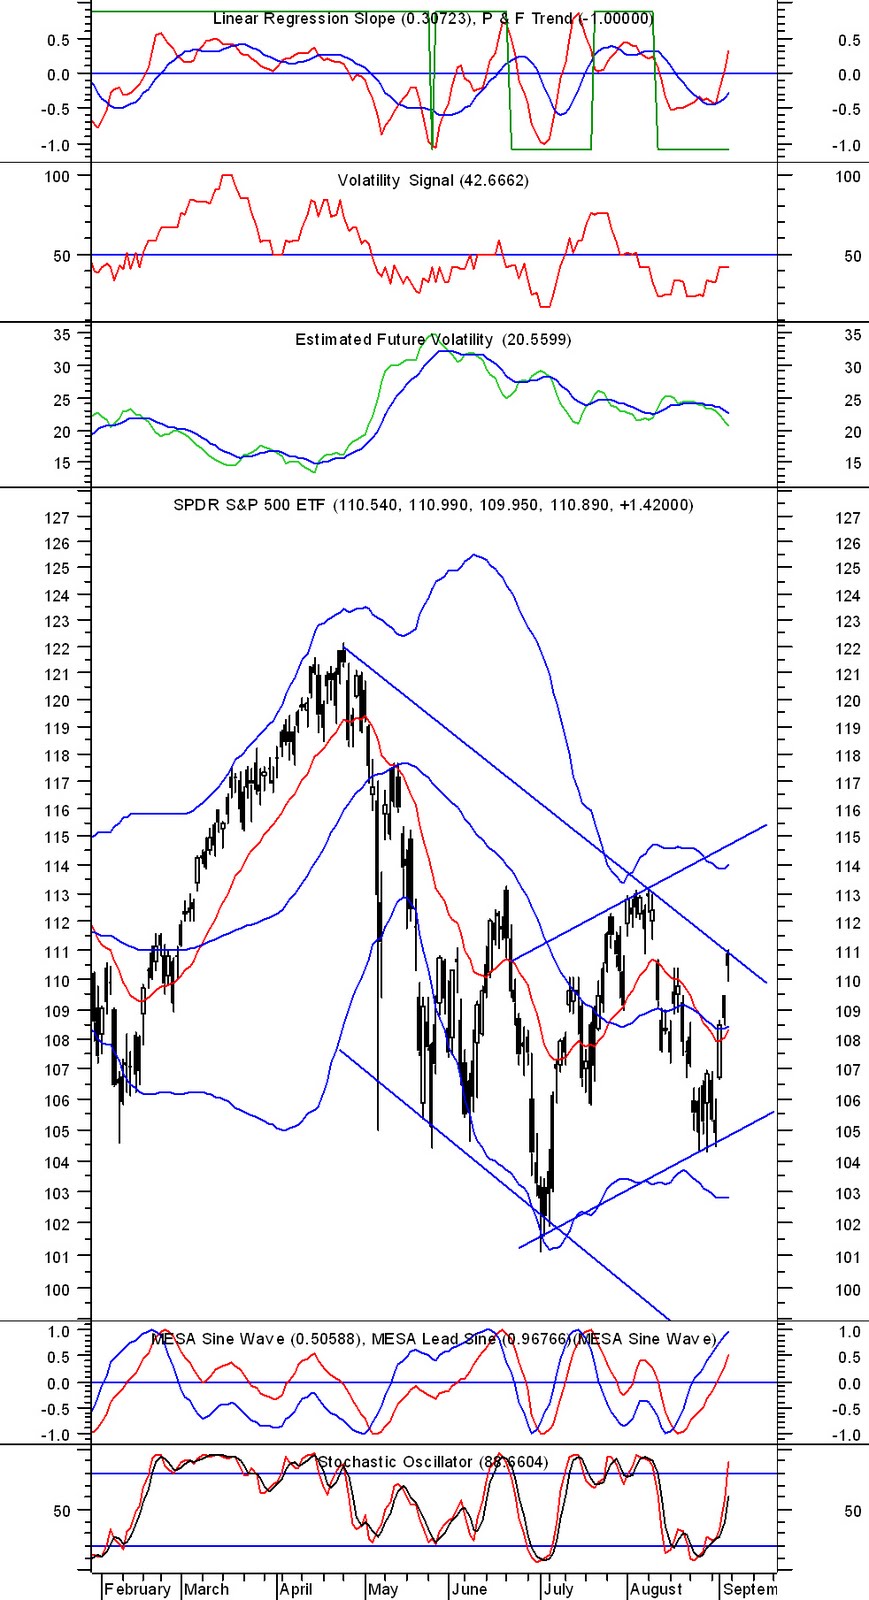
-SPY closed the week right at the resistance level of wider, falling channel lines. The most recent low is above the previous low, so if SPY closes above 110.9 level next week, we could see a move upto 116 level. However, because we shot up around 5% in just 3 days and because 113.2 level has been the top of the previous two highs, I would expect SPY to consolidate sideways next week before building up more energy to breakout to the upside.
- The reason I am more bullish then bearish on the market is because AG and commodity stocks are showing higher highs and lower lows. These were the stocks that fell way before the overall market did back in April, and it seems as though the strength in these stocks are leading the market upwards as well.
- Most of my technical indicators are bullish and EFV is at 20.55, while implied volatility in SPY at-the-money options is 20. Of course, SPY could fall and implied volatility on options rise, I believe there is higher probability of SPY going higher. I would look to put 1/2 long delta position on Monday and the other half on weakness. Finally, I am tempted to go neutral SPY vol since it has fallen from 27 to 20 this week, but EFV indicator is showing that's it is in a downward trend, so I would not go long vol.

Wednesday, September 1, 2010

SPY Daily Chart w/Today's Intraday Prices


- SPY opened above the short-term channel lines, which was signal to buy-in short position at 106.70. Position entry was at 110.50 so 3.8 points profit plus 1/2 position bought in at 104.5 and resold at 106.5 for an extra 1 point profit.

- SPY level 107.8 - 108.8 are resistance levels. Half the technical indicators are showing bullish signals, half still bearish so no positions at this moment.

- Implied Volatility on SPY has fallen to 23, which is now more in line with EFV value at 22. My short options bias was correct when SPY IV was at 27.